Thieves in Your Cash Flow
A value investor's guide to reading cash flow statement the way Buffett intended

Every year, thousands of intelligent investors sit down with annual reports, flip straight to the income statement, calculate a P/E ratio and congratulate themselves on doing their homework. Meanwhile, three lines sit quietly in the middle of the cash flow statement — changes in receivables, changes in inventory, changes in payables — patiently emptying the register. Charlie Munger once said, “Show me the incentive and I’ll show you the outcome.” The income statement has every incentive to look good. The working capital section has no such motivation. It simply tells you the truth. This is a piece about that truth.

The Formula, As Buffett Wrote It
In his 1986 Berkshire Hathaway Annual Letter, Warren Buffett defined owner earnings as reported earnings plus depreciation & amortization, less the average annual capital expenditures required to fully maintain the business’s long-term competitive position and unit volume.
The full formula, as practitioners have synthesized it, reads:
Owner Earnings = Net Income + Depreciation & Amortisation ± Other Non-Cash Charges − Maintenance Capex ± Changes in Working Capital
He added a crucial qualifier about incremental working capital requirements and certain other non-cash charges. The mechanics are straightforward enough. When working capital increases — when a company ties up more cash in receivables and inventory than it recovers from payables — the change is negative on the cash flow statement. This reduces operating cash flow.
Think of reported earnings as water poured into a bucket. Depreciation gets added back — fair enough, it didn’t actually flow out as cash. Maintenance capex is deducted — because the bucket has a hole that must be patched every year just to stay functional. Working capital is the second hole. Smaller, less visible, but just as real. Ignore it and your bucket empties faster than the income statement ever warned you.
The sign convention is mechanical: rising working capital is a cash outflow, falling working capital is a cash inflow. But the real question — the one that separates a thoughtful analyst from a mechanical one — is not about the sign at all. It is about the nature of the hole. Is it temporary? Is it the cost of growth? Or is it simply the permanent price of being in this business?
Buffett’s own words that give us the test: the relevant deductions are those required “to fully maintain its long-term competitive position and its unit volume.”
This is the competitive-position maintenance test and it draws a hard line between three very different categories of working capital change.
Category One: Growth-Driven Working Capital
When a company expands revenue, it naturally needs more inventory on the shelves and more receivables on its books. This working capital increment is discretionary — it is the cost of growth, not the cost of survival. If inventory is building because the company wants to grow, you arguably do not penalize the maintenance owner earnings for it. You are not buying the business at its current scale; you are buying a growing one.
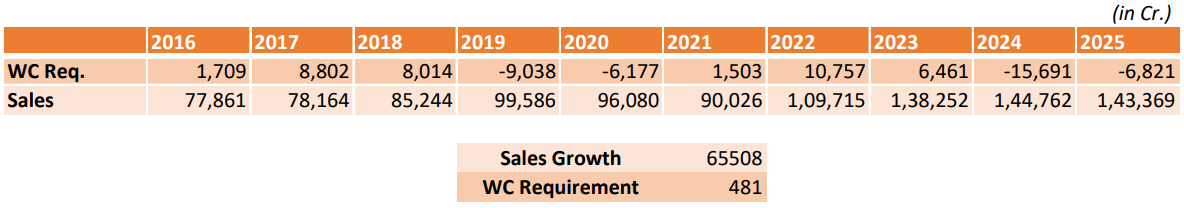
Examples: Coal India. Over the last decade, Coal India’s sales grew by ₹65,508 Cr. Over the same period, the incremental working capital requirement was a mere ₹481 Cr i.e. less than 1% of every incremental rupee of sales. This is the hallmark of a business that does not need to feed its working capital to grow.
Category Two: Cyclical or Seasonal Working Capital
Some industries experience working capital swings driven by seasons, commodity price cycles, or credit cycles. Inventory builds before a season; receivables spike at peak cycle; payables compress when suppliers tighten terms. These are temporary distortions. The correct normalization is a full-cycle basis to ensure at least one complete cycle is captured before drawing conclusions about the maintenance burden.
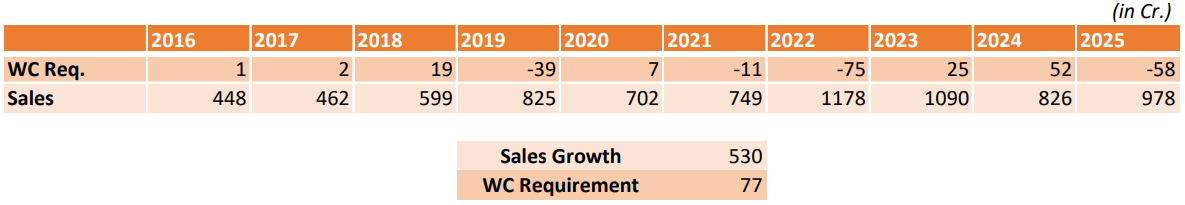
Examples: Excel Industries. Over the last decade, Excel Industries’ sales grew by ₹530 Cr, against an incremental working capital requirement of ₹77 Cr — roughly 14% of incremental sales. But the more instructive story lies inside the annual data. In FY19, when sales jumped over 35%, the company needed a sharp build-up in working capital; as the cycle normalised, the WC requirement reversed and the adjustment turned positive. The same pattern repeats visibly in FY22, FY23 and FY24. The lesson: no single year’s CFO tells you anything meaningful here. Only the full cycle reveals the true maintenance burden — and over the full period, Excel’s WC requirement is modest and mean-reverting.
Category Three: Structural Working Capital
This is the dangerous one — the one most investors misread and most companies understate. This is where a business, year after year for a decade, requires an ever-growing pool of capital simply to hold its place: not to grow, not because of a seasonal quirk, but because the economics of its industry demand it. Suppliers hold the power, so payables are short. Customers hold the power, so receivables are long. And inventory cannot be reduced below a threshold without risking production continuity or customer relationships. If your 10-year dataset shows a negative working capital adjustment in every single year without exception, you are likely looking at a permanent structural feature of the competitive position — or rather, the absence of one.
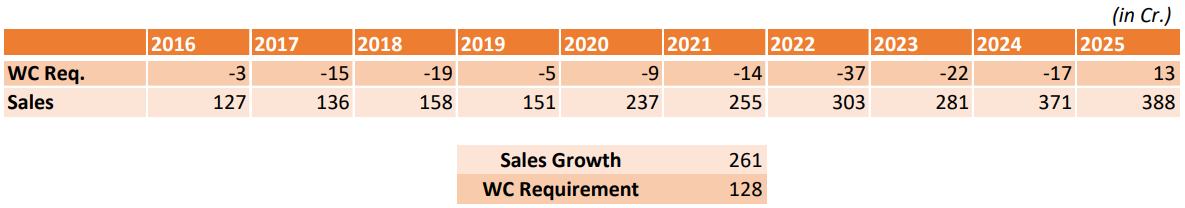
Example: Patels Airtemp. Over the last decade, Patels Airtemp’s sales grew by ₹261 Cr. But ₹128 Cr of that — approximately 50% — was simultaneously absorbed into incremental working capital. Put plainly: for every rupee of revenue this business grew, it had to lock away half a rupee back into the operating cycle, where it earns nothing. The WC drain is not seasonal and it is not tied to an expansion bet. It is the permanent cost of running this business at any scale.
The Owner Earnings Formula, Properly Applied
For a business with persistent structural working capital demands (Category 3 companies) the normalized owner earnings calculation must look like this:
Normalized Owner Earnings = Average 10-Year Net Income + D&A − Average Annual Maintenance Capex − Average Annual Structural Working Capital Outflow
Here is where the practitioner’s eye must sharpen beyond the formula.
Buffett and Munger have consistently argued that the finest businesses generate more cash than their earnings because working capital actually shrinks relative to sales as they scale. Think of a consumer-facing FMCG companies like HUL, that collects cash at the counter and pays distributors 60 days later — working capital is a source of float, not a drain. Phil Fisher, in Common Stocks and Uncommon Profits, framed this as a test of operating efficiency: How much incremental capital must the business deploy to generate each incremental rupee of revenue?
A business that structurally consumes working capital every single year is communicating something precise about its competitive position. It likely lacks pricing power (hence extended receivables), lacks purchasing power with suppliers (hence unfavorable payables terms), or operates in a commodity pass-through environment where large, powerful counterparties on both sides of the transaction dictate terms.
The Normalization Protocol: A Practitioner’s Checklist
When you encounter a company with a decade of persistent working capital outflows, run through this sequence before finalizing your owner earnings estimate:
Identify the driver.
Is WC growing because revenue is growing (growth-driven), because the cycle is at a seasonal peak (cyclical), or because the business model requires it structurally (competitive-position)?
Decompose the CFO.
Separate reported operating cash flow into earnings-derived cash flow and working capital effects. Analyze both independently across the full 10-year period.
Compute the average annual WC drain.
Do not use a single year. Use the 10-year average to smooth commodity-price-driven swings in receivables and inventory.
Apply the maintenance test.
Ask, in Buffett’s exact words: Is this working capital required “to fully maintain its long-term competitive position and its unit volume?” If yes, it is a permanent deduction. If it is clearly growth capital — Laxmi Organic scaling a new fluorine platform — treat it separately in your reinvestment assumptions.
Assess capital efficiency.
Calculate the incremental working capital required per rupee of incremental revenue over the decade. If this ratio is rising, the business is becoming less efficient and the owner earnings are being eroded in real terms even if net income holds steady.
The Final Lesson
Warren Buffett once wrote that he would rather have a business that earns 15% on zero incremental capital than one that earns 40% but demands constant reinvestment just to hold its ground. Working capital is one of the quietest forms of that reinvestment demand. It shows up every year, it earns nothing, and it has the patience of a creditor. The analyst who ignores it is not being optimistic. They are being imprecise.
Owner earnings is not accounting. It is economics. And in economics, a cost is a cost — whether it wears the label of capex, depreciation, or a three-line adjustment at the bottom of your operating cash flow.
For the ease of calculation, I skip the line-by-line WC adjustment and use this instead:
Owner Earnings = Average Operating Cash Flow (over 5-7 yrs.) − Maintenance Capex + Growth-Driven Working Capital (for Category-1 Companies)
This single step already absorbs depreciation, non-cash charges, and the incremental working capital drain — without adding complexity. The goal was never a precise number. It was an honest one.
Now as a reader of this article, I hope you all to use Owner Earnings instead of P/E multiple. P/E can be manipulated but Owner Earning can’t be.
Now the real homework: Open your portfolio, pull up ten years of cash flows, and drop a comment telling us which category your holdings fall into. Category 1 — the compounding machine. Category 2 — the seasonal drama queen. Category 3 — the polite cash incinerator.
Because the best way to know whether you have truly understood something is to apply it to money you actually own.
Disclaimer: I am not a SEBI Registered Investment Advisor. The views and analysis expressed in this post are for educational and informational purposes only and do not constitute financial advice, investment advice, or a recommendation to buy or sell any securities. Investing in the stock market involves significant risks. Please consult with a qualified financial advisor before making any investment decisions. The author shall not be held responsible for any financial losses or decisions made based on this content.
The number most people miss is the incremental working capital per rupee of revenue, not the absolute level, but whether that ratio is getting better or worse over time. A business can look like Category 2 for five years and cross into Category 3 without anyone noticing because the annual swings distract from the direction of travel.
Patels Airtemp isn't unusual; a lot of Indian mid-caps in engineering and chemicals sit exactly here, growing topline, reasonable margins, and a working capital cycle that neutralises most of it. The P&L gets the headline, the cash flow gets the footnote.
Buffett's test was never about the formula rather, it was about whether the business earns the right to keep what it makes. A lot of businesses in this market don't.